
After the reboot of the minor leagues
in 2021 and rule changes in 2022,
what bodes for MLB?
In my "day job" at the National Library of Medicine, and in my teaching, I'm often an advocate for using data visualization to help make decisions based on the data, and not just on facts and intuition. In fields like baseball (and many others), this can be a challenge because the decision makers often have years and years of experience that they harness -- deservedly -- when thinking about tactics and strategies.
To be clear, I strongly support using both data and intuition to guide thinking, because over-reliance on either one can lead to bad outcomes. Rely too much on data, and one can fail to account for results that the data can't anticipate. Rely too much on one's own knowledge and intuition, and decisions could rely too much on subjective biases or preferences. But using data to inform decision making and insights makes sure that beliefs and ideas are grounded in something that can stand up to scrutiny.
Case in point: in 2021, the year following a lost COVID-19 pandemic season, a lot of changes came to pass in professional baseball. After years of a loose relationship with the minor leagues, Major League Baseball took greater control of Minor League Baseball. Some were quite drastic: MLB contracted about forty minor league teams, and those that remained often shifted affiliations with major league teams, and the level at which they played. The leagues were consolidated into four levels (low A, high A, AA, and AAA), with three leagues in the three lower levels and two leagues in AAA.
MLB began to use the minor leagues as a test bed for rules changes, typically designed to speed games and provide more scoring and excitement for fans. Low-A, in 2022, was slated for three major changes that are now scheduled to be adopted in the major leagues for the 2023 season:
- Limits on the infield shift, requiring infielders to play on each side of second base;
- Limits on pitchers' pickoff moves to first base; and
- Institution of a pitch clock
- Pitching, shown by ERA versus walks and hits per inning pitched (WHIP).
- Batting, shown by OBP versus SLG.
- Fielding, shown by errors and double plays per game.
- Team stolen bases by league and year.
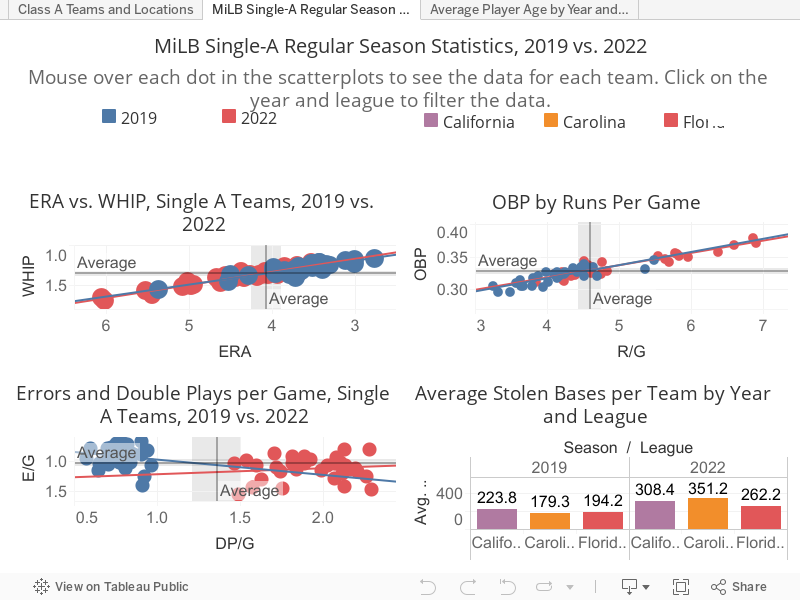
- Pitching performance declined, with higher ERA and WHIP in 2022, though the regression lines are virtually identical.
- Offense improved, with higher SLG and OBP in 2022, though as with pitching, the regression lines are also identical.
- What I read in this is that the rules here--probably centered on the pitch clock and restrictions on the shift -- resulted in more batters reaching base. And as we know from Moneyball, getting on base is a key predictor for scoring runs.
- Fielding and base stealing are both interesting. The average number of stolen bases across all leagues rose 54 percent from about 199 to about 307 per year. However, while errors and double plays per game both rose in 2022 while in 2019 there was a positive relationship between errors and double plays, in 2022 the relationship was inverse--meaning that teams traded double plays for errors, without any significant tradeoff in fielding percentage.
Comments
Post a Comment