Women in Baseball Week, and how to visualize twelve years of the first major baseball league for women
Last year, I met Ryan Woodward and Kat Williams of the International Women's Baseball Center for the occasion of Women in Baseball Week, to recognize both the achievements of pioneers of the All-American Girls Professional Baseball League like Joanne Weaver, Shirley Burkovich, "Lefty" Alvarez, and so many others, as well as those of women and girls who are playing, and involved in the game, today. This year’s WIBW is from July 23 to 28, with events online, in Rockford, Illinois, and elsewhere across the US and Canada.
Last year's event was utterly inspiring, and this year there are even more games and events celebrating the achievements of women in the great sport of baseball. I can't claim to have played competitive baseball. If only when I was a kid had I had the opportunity to start playing in a way that would have let me compete on a team in high school or even college. Maybe as a workhorse, decently fielding third baseman with a decent bat (hitting for average if not for power). I get a great deal of satisfaction knowing that girls and young women today have opportunities to play, coach, and work in baseball.
So, I content myself (very happily) with researching and showing interesting trends in baseball, which takes advantage of the data visualization tools that we have available to us now. I often tell my students that visualization is the first and last mile of research; the first mile in that it's valuable for exploring the data, and the last mile because it's how data becomes truly relevant to people -- especially those who aren't comfortable with math, statistics, or poring through spreadsheets.
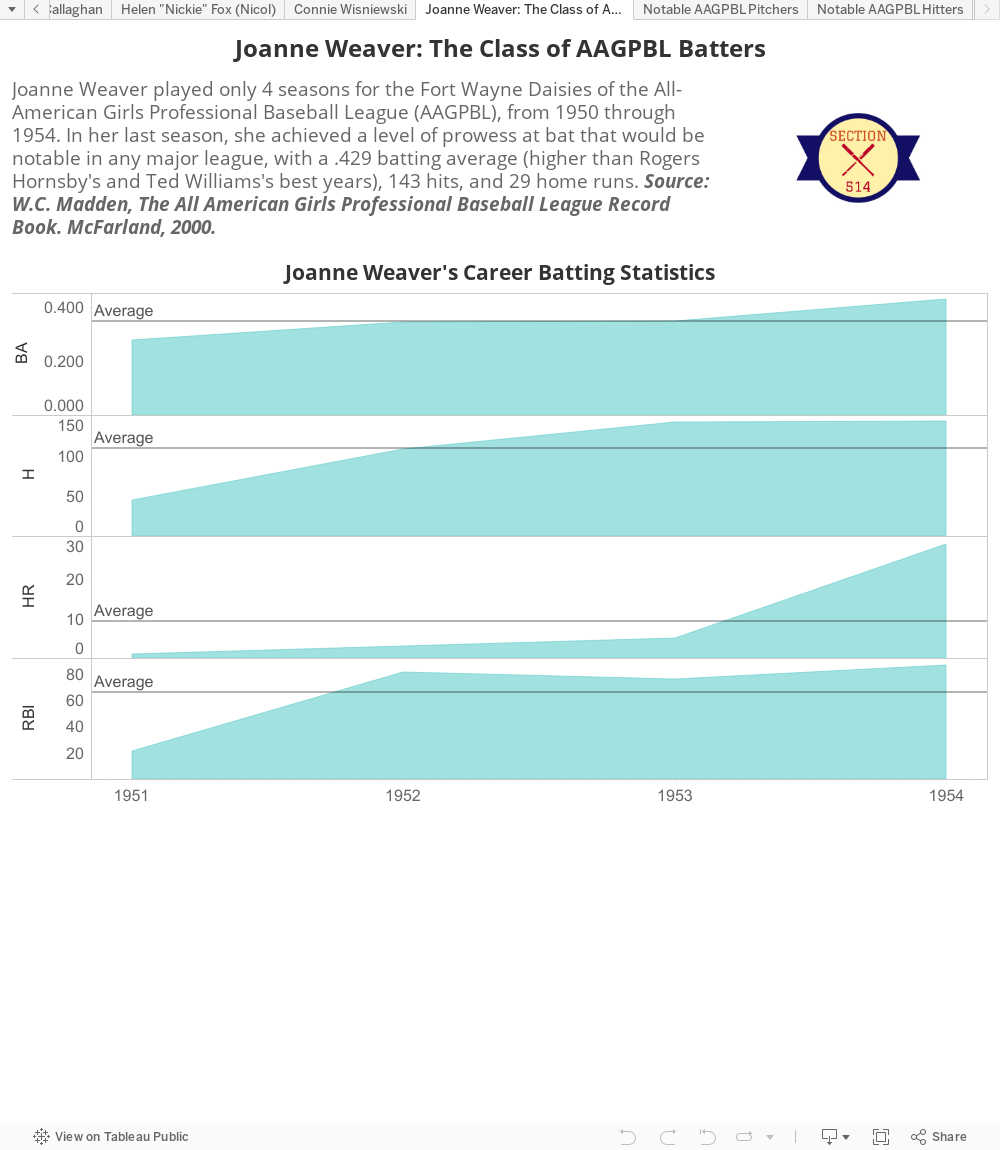
In celebration of last year's Women in Baseball Week, I created a Tableau Public workbook - click on this link to explore it - about the AAGPBL in general, and notable players in particular. (The league played for twelve seasons in the midwestern US, developing a progressively greater emphasis on offense, with achievements including Joanne Weaver's .429 batting average in 1954, one of the highest averages in any league in history, and Connie Wisniewski's 33 wins as a pitcher in 1946.)
I described the research process in an article for the Data Visualization Society's Nightingale magazine. Suffice to say that the exercise of transcribing and then cleaning data from a hard copy book was challenging and time consuming, but well worth the effort. (The source was W.C. Madden's The All-American Girls Professional Baseball League Record Book: Comprehensive Hitting, Fielding, and Pitching Statistics. It's an impressive book, filled with histories and notable achievements of the league from its founding in 1943 through its final season in 1954.
I hope to be talking about this more in the coming months to help other baseball researchers - and researchers interested in other sports - use data visualization to make complex statistics understandable and resonant for new audiences.
It's hard to overstate the level of effort that was required to translate a softcover book on baseball statistics into a digital database. It took weeks' worth of evenings just to key in the data, and then more time to make corrections and compute missing statistics. Please let me know in the comments whether you are interested in learning more, or feel free to reach out to me on LinkedIn -- and see you next month for Women in Baseball Week!
Comments
Post a Comment